At the start of the LIFE-MICA project, it was proposed that all the waterways in the test areas (approximately 12,000 km in Noord-Holland and 30,000 km in Fryslân) were going to be sampled and analysed for muskrat eDNA. In line with the ultimate goal of sampling all ~ 300,000 km waterways in the Netherlands post LIFE-MICA. Complete sampling of all the waterways in dedicated polders in Noord-Holland and Fryslân was indeed performed by the trappers. The results showed a Fryslân polder completely negative for muskrat eDNA and conversely a Noord-Holland polder with a higher number of eDNA positive tracks than practically usable.
Important feedback from the trappers revealed that sampling many ditches in a polder with complete coverage is extremely time and labour intensive as well as tedious. It also does not match with their current muskrat management strategy, where only in areas with higher populations of muskrat more hours are spent tracking. Areas with lower populations is less intensively monitored.
Based on the eDNA results and the feedback from the trappers, we decided to investigate the possibility of sampling only a representative subset of the waterways, while still maintaining high certainty of the actual muskrat population in an area. This approach was set-up using a so-called statistical power analysis, in which the entire management area is divided into smaller areas. To determine whether an area is empty of muskrat, the power analysis showed that sampling 80 5 km tracks in an area will suffice.
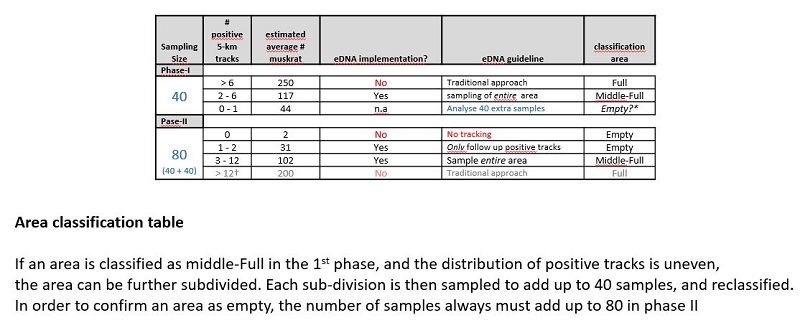
To further limit the necessary number of samples, the test was separated in to 2 phases. In phase I, 40 samples are taken in a defined area. Depending on the results, an area is then categorized as “full” “mid-full” or “possibly empty”. If an area is determined full, further use of the eDNA method has no added value, and the area is more suitable for tracking using the traditional approach. If an area is “mid-full” the entire area should be eDNA sampled. However, in the event muskrats are non-evenly spread over an area, the “mid-full” area can be further subdivided. These sub-areas are subsequently sampled again to add up to a total of 40 samples for each sub-area (for example if in one sub-area had 18 samples in the 1st round, 22 extra samples are taken to get to 40 samples in total and for the other area with 22 samples in the 1st round 18 extra samples are taken). The sub-areas can then be re-classified based on the results of the 2nd round. For any area that is classified as “possibly empty” in phase I or II, 40 additional samples need to be taken to get to the 80 samples required to confirm that it is indeed empty (phase II) table I.
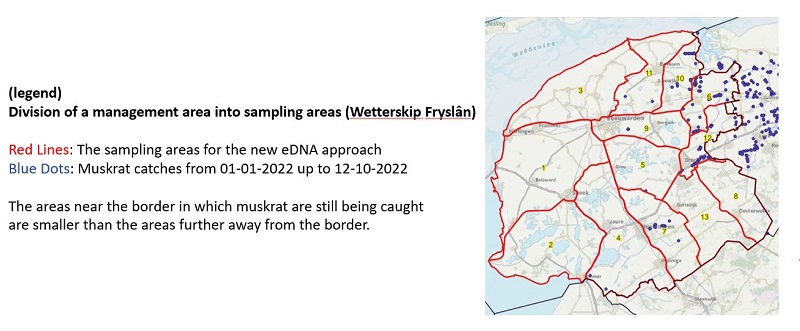
To confirm if this approach is indeed feasible, a retrospective experiment was designed using already available sampling and muskrat catch data of certain sampled areas. This experiment showed that the approach does indeed work. Because muskrat have preferential areas, the selection of tracks within an area is not entirely random. Waterways in which muskrats have been caught in the past few years are always sampled. The area is subsequently sampled with random tracks in the other waterways to gain equal distribution of tracks in the entire area. For the power analysis, the size/number of waterways in an area does not matter. It is however important that an area is not so small that taking 80 samples constitutes full coverage. Depending on muskrat presence history one can choose to make areas with no or few catches larger, and areas with many recent catches smaller (Image I). The aim for the remainder of Life-MICA is to implement the approach in Noord-Holland and Fryslân.
The most important aspect of this approach is that by reducing the number of necessary samples, large areas, and eventually the whole of the Netherlands, can efficiently be monitored for muskrat presence and therefore provides a means on how to employ the trapper’s capacity most effectively.


